Analyzing County-level COVID-19 Symptoms Pattern and Risk-factors Correlated with Hospitalization Rate, ICU Treatments and Morbidity Rate
October 2021 - Present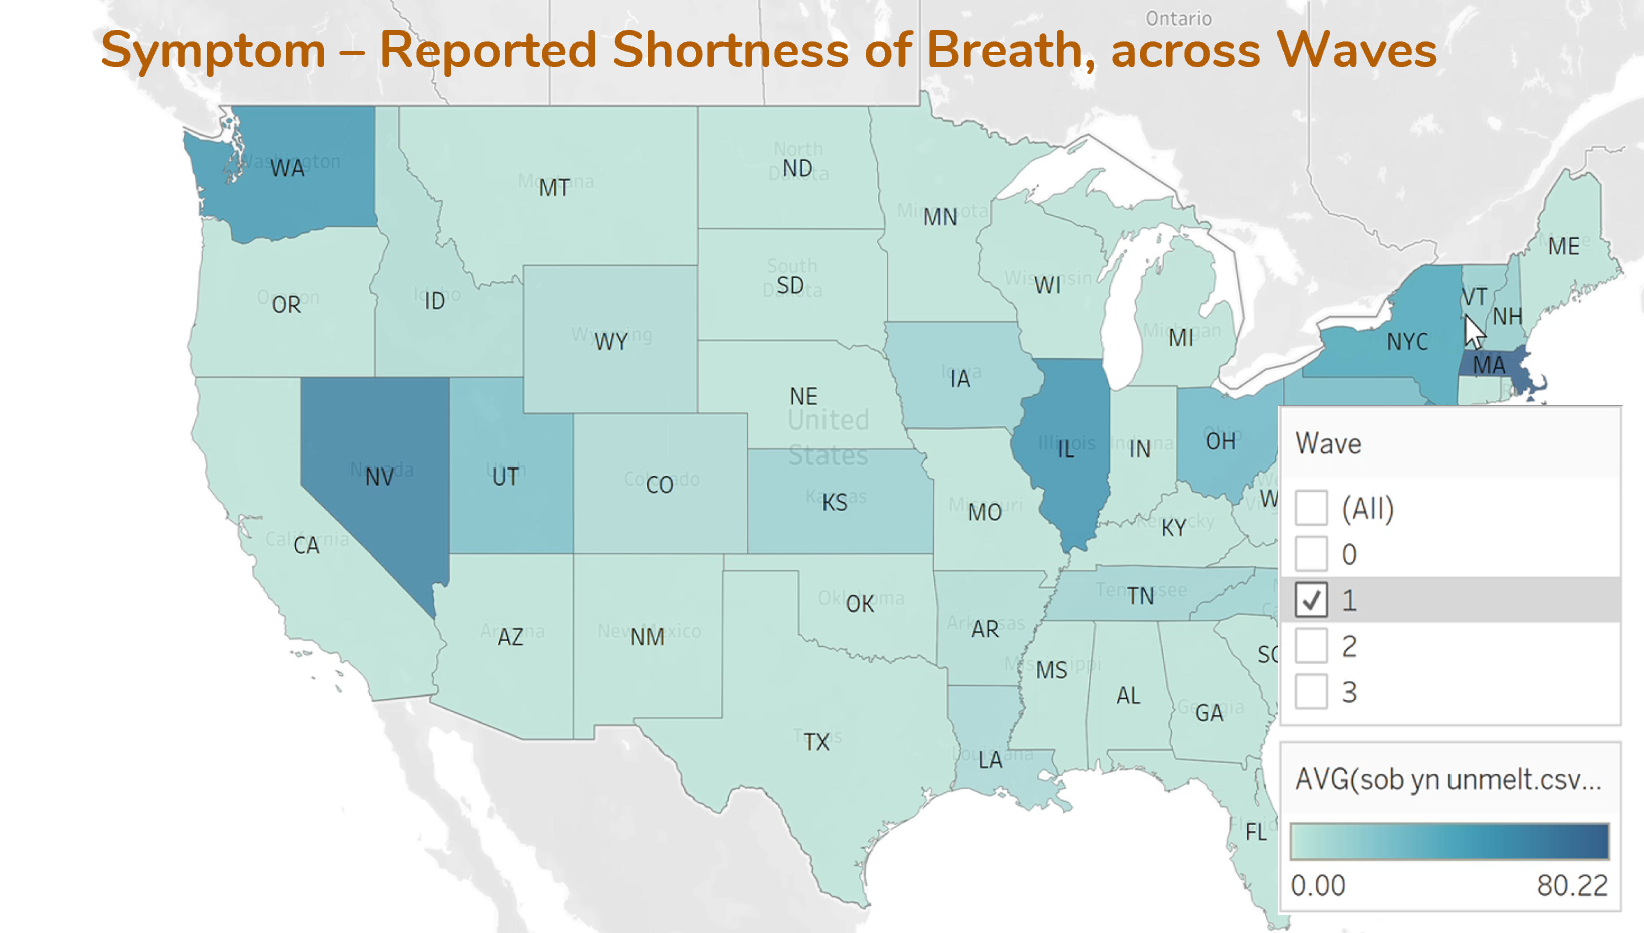
Description
We built a web-based visual analysis tool to identify key characteristics of different regions in the US (counties, cities, or states) and explain the similarity among them and compare counties based on these key factors. We aim to study factors such as age, race, and the population of a particular region and the prevalent symptoms along with their temporal trajectories. We developed a series of visualizations to understand, explore and derive insights from the COVID-19 CDC restricted access dataset. We utilize statistics and ML-based approaches to reduce the dimensionality of the dataset to summarize the dataset and then perform clustering of the counties to identify counties based on their vulnerability to COVID deaths, hospitalizations, and ICU cases. We also performed correlation analysis to identify driving factors of morbidity rate and other target variables. These counties can further be studied to identify weak public health infrastructure, government policies, or inadequate response by the US government.