Chicago Shadow Map
Big Data Visualization Project, September 2021

Description
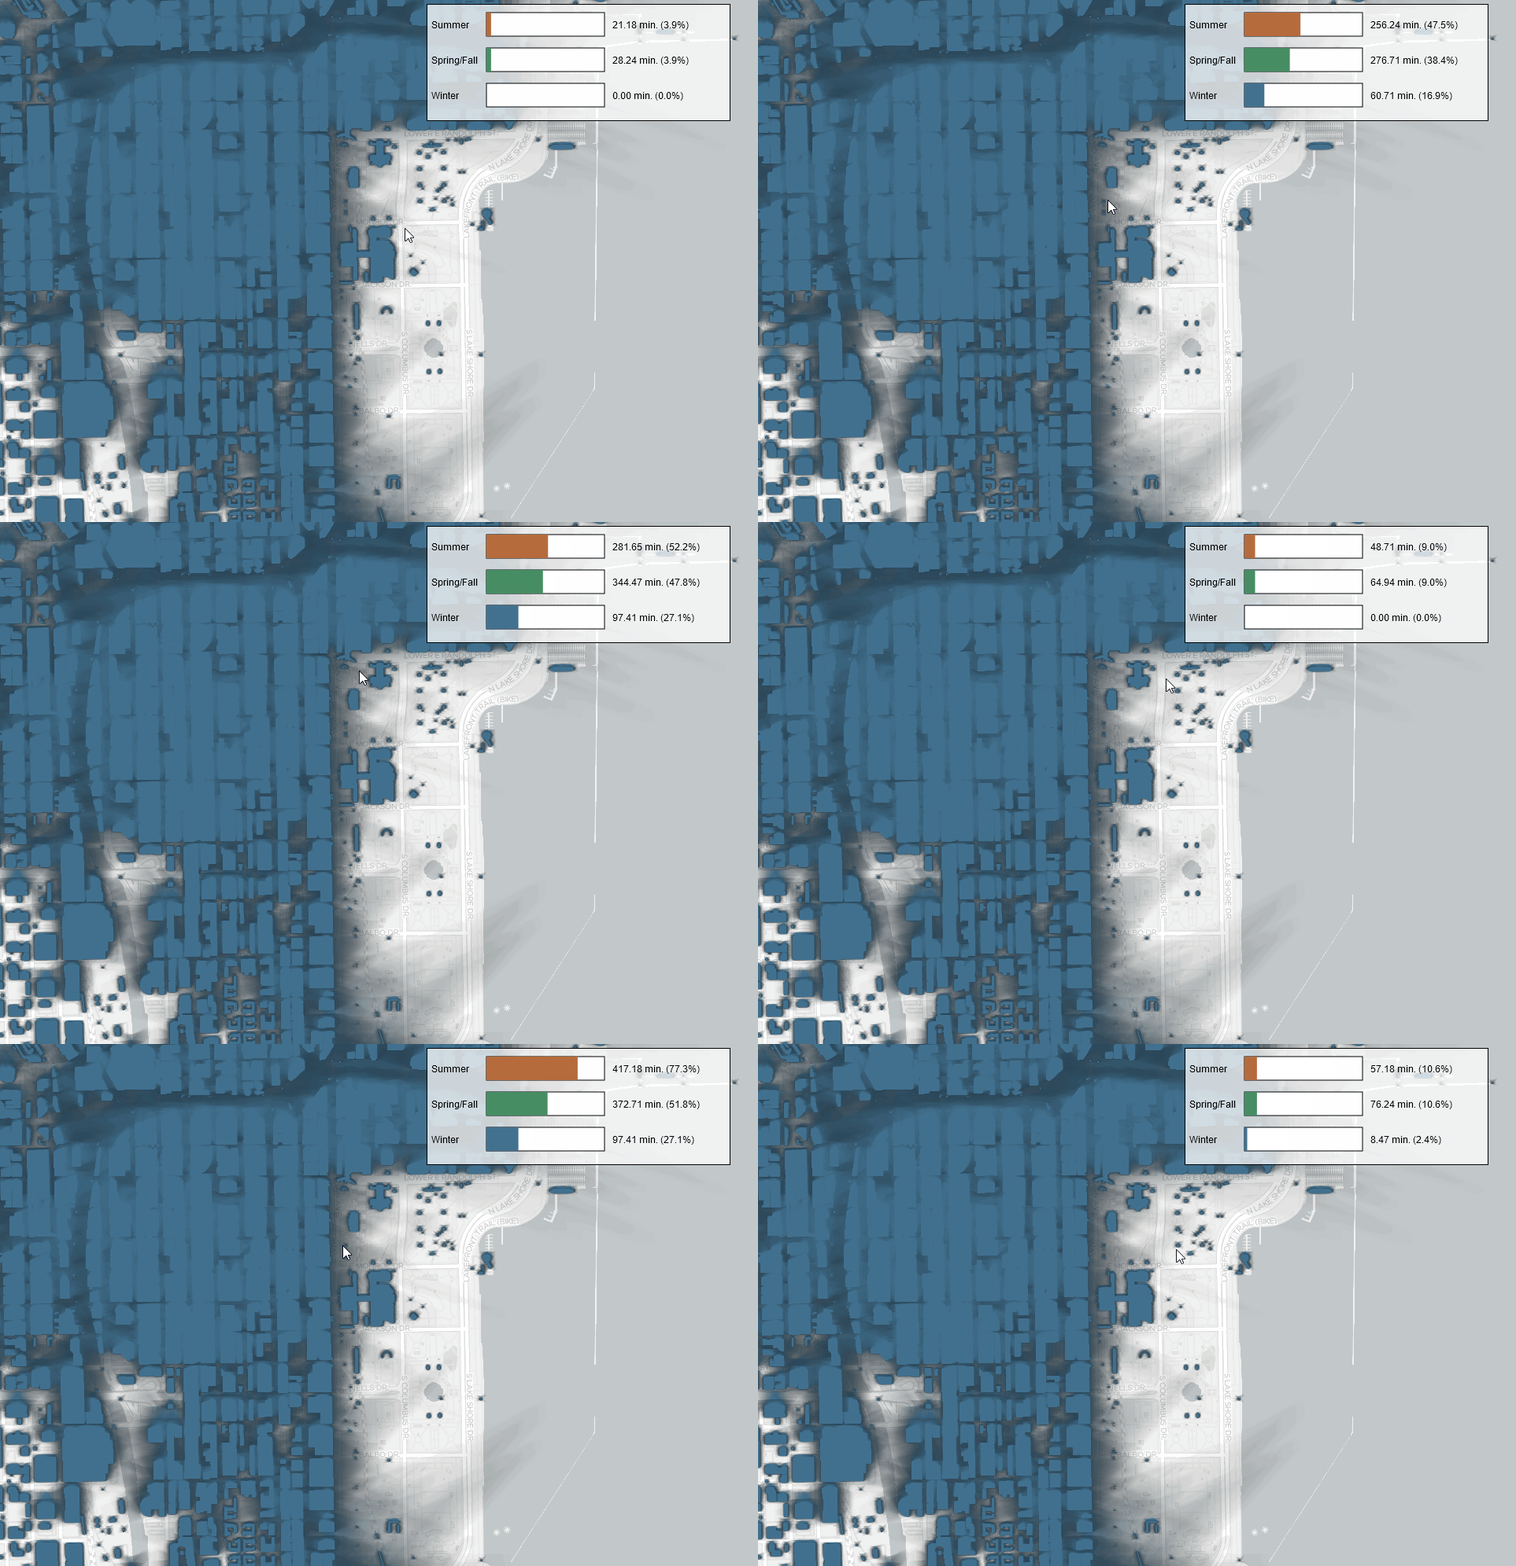
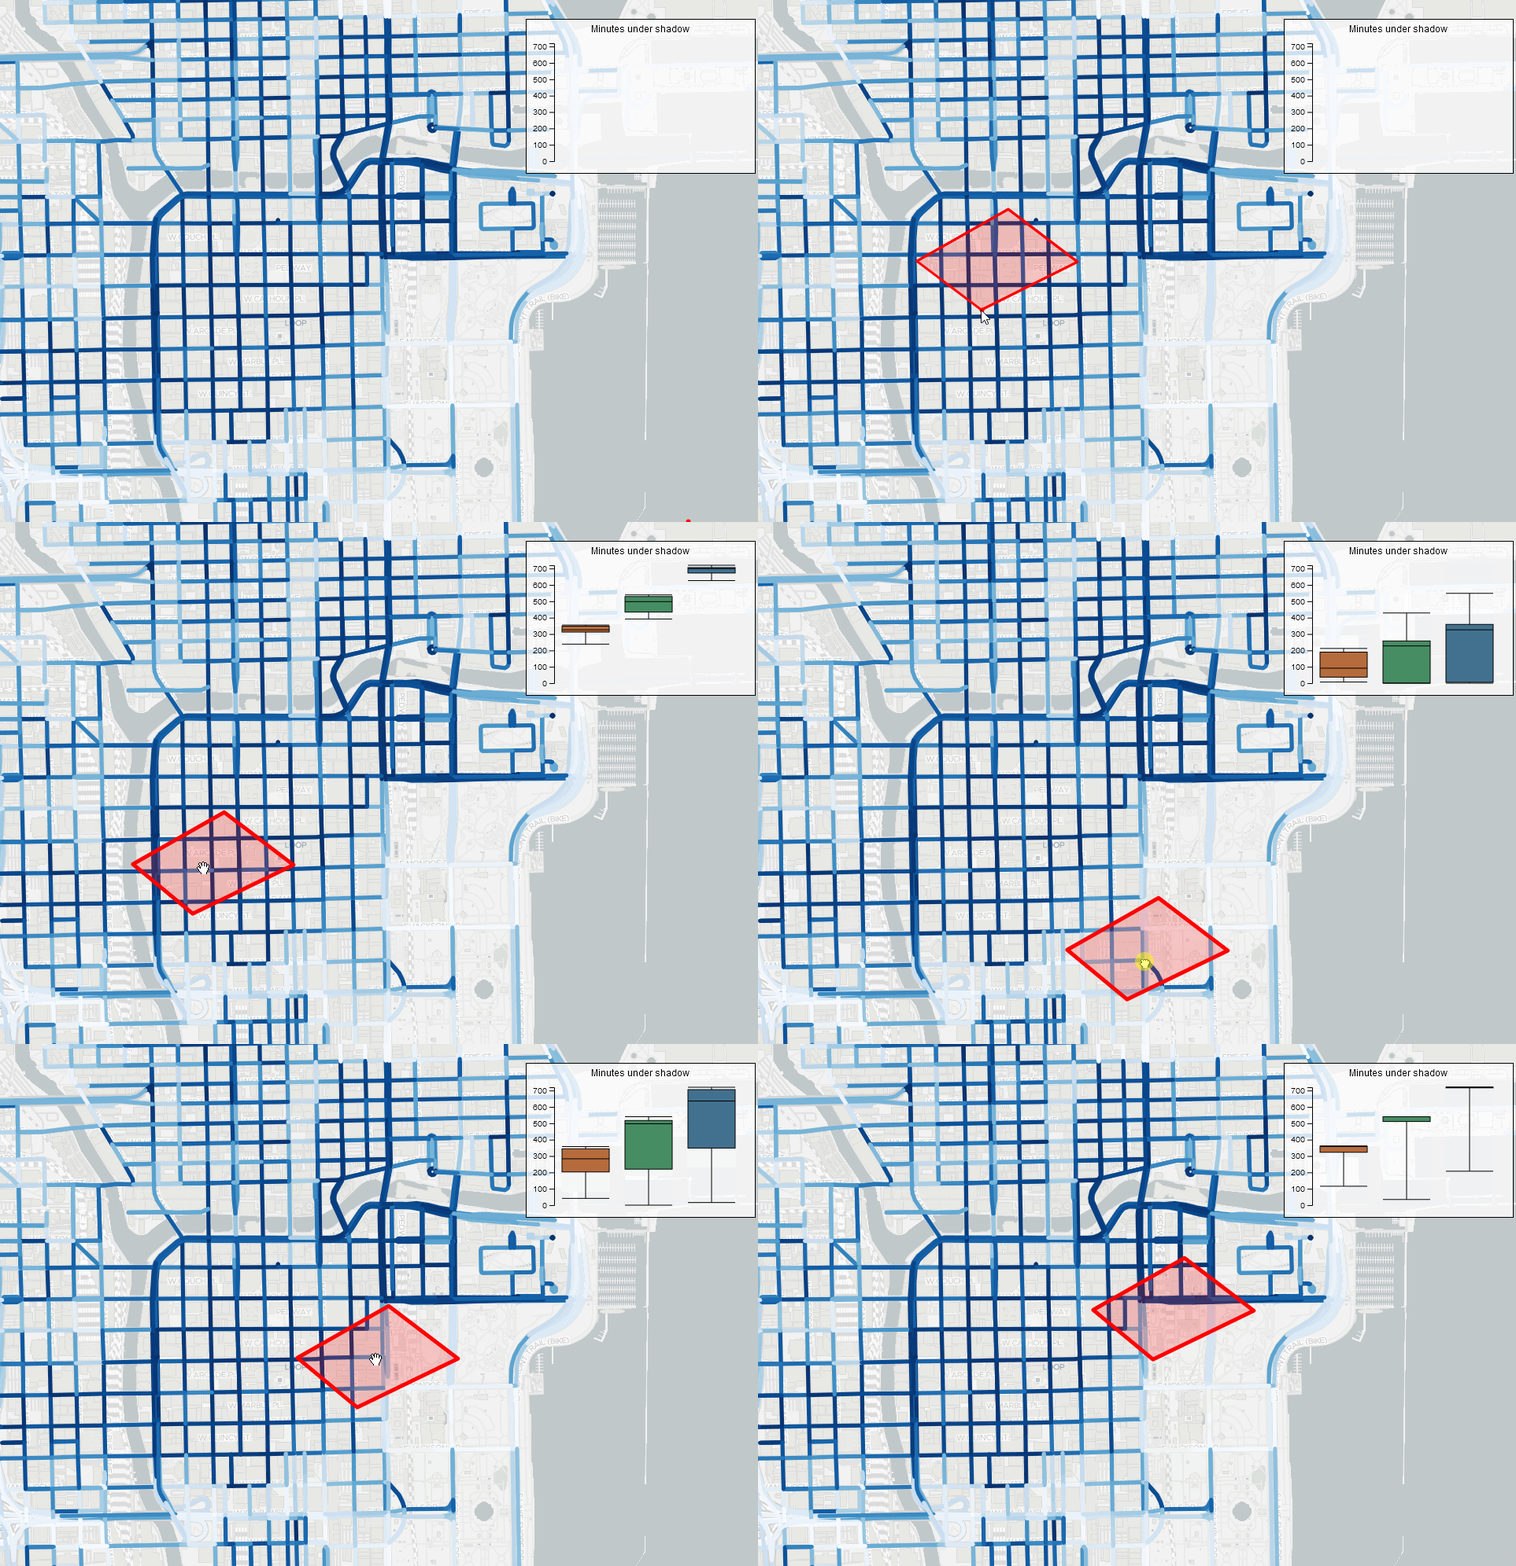
I used JavaScript / TypeScript, D3.js, Angular, OpenLayer map and Flask to build this application to visualize the distribution of accumulated shadows for each season of the year, making use of a front-end and back-end infrastructure.