Probability distributions are omnipresent in data analysis. They are often used to model the
natural uncertainty present in real phenomena or to describe the properties of a data set. Designing
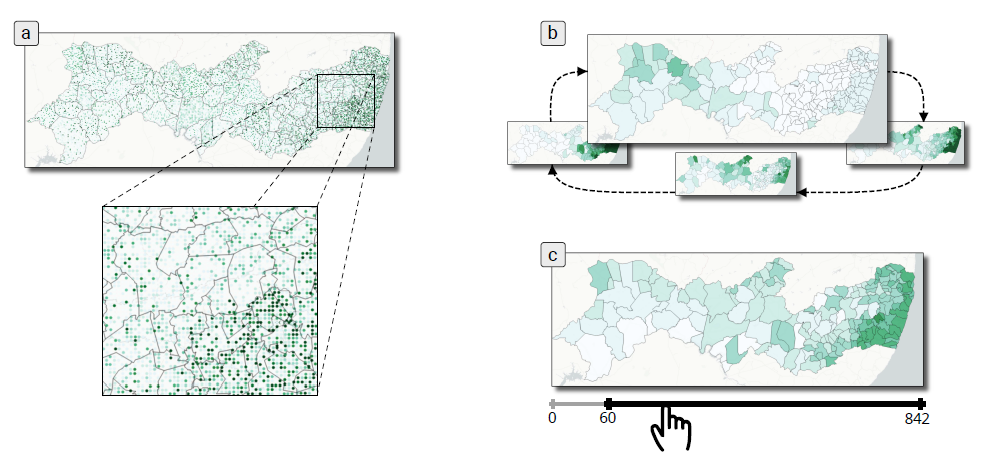
efficient visual metaphors to convey probability distributions is, however, a difficult problem. This
fact is especially true for geographical data, where conveying the spatial context constrains the design
space. While many different alternatives have been proposed to solve this problem, they focus on
representing data variability. However, they are not designed to support spatial analytical tasks
involving probability quantification. The present work aims to adapt recent non-spatial approaches
to the geographical context, in order to support probability quantification tasks. We also present a
user study that compares the efficiency of these approaches in terms of both accuracy and usability.
                            @article{srabanti2022comparative,

                              title={A comparative study of methods for the visualization of probability distributions of geographical data},

                              author={Srabanti, Sanjana and Veiga, Carolina and Silva, Edcley and Lage, Marcos and Ferreira, Nivan and Miranda, Fabio},

                              journal={Multimodal Technologies and Interaction},

                              volume={6},

                              number={7},

                              pages={53},

                              year={2022},

                              publisher={MDPI}

                            }
The annual incidence of head and neck cancers (HNC) worldwide is more than 550,000 cases, with around 300,000 deaths each year.
However, the incidence rates and disease-characteristics of HNC differ between treatment centers and different populations, due to undetermined reasons, which may or not include socioeconomic factors.
The multi-faceted and multi-variate nature of the data in the context of the emerging field of health disparities research makes automated analysis impractical.
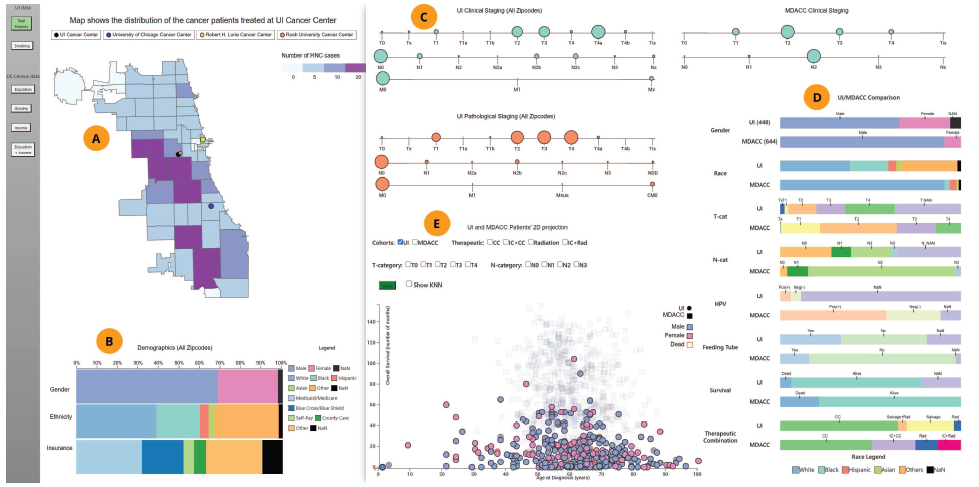
Hence, we present a visual analysis approach to explore the health disparities in the data of HNC patients from two different cohorts at two cancer care centers. Our approach integrates data from multiple sources, including census data and city data, with custom visual encodings and with a nearest neighbor approach.
Our design, created in collaboration with oncology experts, makes it possible to analyze the patients' demographic, disease characteristics, treatments and outcomes, and to make significant comparisons of these two cohorts and of individual patients.
We evaluate this approach through two case studies performed with domain experts.
The results demonstrate that this visual analysis approach successfully accomplishes the goal of comparing two cohorts in terms of different significant factors, and can provide insights into the main source of health disparities between the two centers.
                            @inproceedings{srabanti2022tale,

                                title={A tale of two centers: Visual exploration of health disparities in cancer care},

                                author={Srabanti, Sanjana and Tran, Michael and Achim, Virginie and Fuller, David and Canahuate, Guadalupe and Miranda, Fabio and Marai, G Elisabeta},

                                booktitle={2022 IEEE 15th Pacific Visualization Symposium (PacificVis)},

                                pages={101--110},

                                year={2022},

                                organization={IEEE}

                              }
The spread of the SARS-CoV-2 virus and its contagious disease
COVID-19 has impacted countries to an extent not seen since the
1918 flu pandemic. In the absence of an effective vaccine and as
cases surge worldwide, governments were forced to adopt measures
to inhibit the spread of the disease. To reduce its impact and to
guide policy planning and resource allocation, researchers have been
developing models to forecast the infectious disease. Ensemble
models, by aggregating forecasts from multiple individual models,
have been shown to be a useful forecasting method. However, these
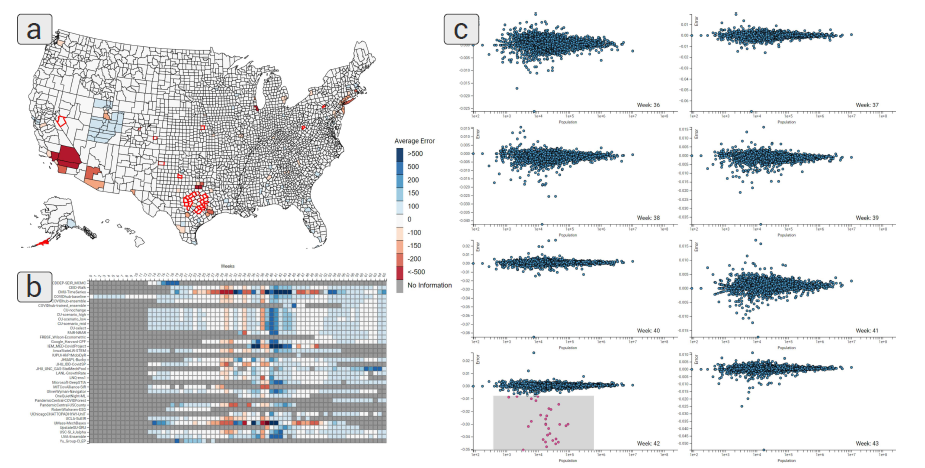
models can still provide less-than-adequate forecasts at higher spatial resolutions. In this paper, we built COVID-19 EnsembleVis, a
web-based interactive visual interface that allows the assessment of
the errors of ensembles and individual models by enabling users
to effortlessly navigate through and compare the outputs of models
considering their space and time dimensions. COVID-19 EnsembleVis enables a more detailed understanding of uncertainty and the
range of forecasts generated by individual models.
                            @inproceedings{srabanti2021covid,

                              title={Covid-19 ensemblevis: Visual analysis of county-level ensemble forecast models},

                              author={Srabanti, Sanjana and Marai, G Elisabeta and Miranda, Fabio},

                              booktitle={2021 IEEE Workshop on Visual Analytics in Healthcare (VAHC)},

                              pages={1--5},

                              year={2021},

                              organization={IEEE}

                            }
According to environmental justice, environmental degradation and benefits should not be disproportionately shared between communities. Identifying disparities in the spatial distribution of environmental degradation is therefore a prerequisite for validating the state of
environmental justice in a geographic region. Under ideal circumstances,
environmental risk assessment is a preferred metric, but only when exposure levels have been quantified reliably after estimating the risk. In this
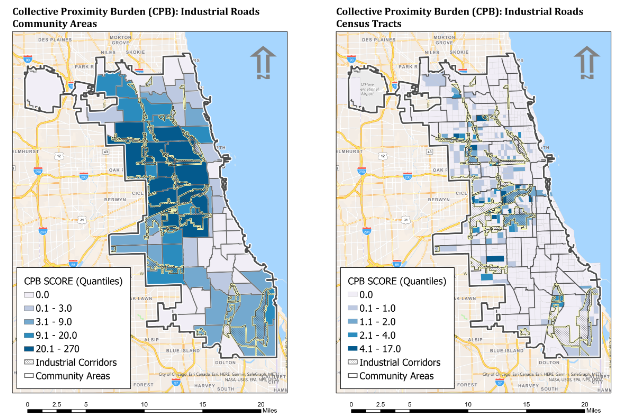
study, we adopt a proximity burden metric caused by adjacent hazardous
sources, allowing us to evaluate the environmental burden distribution
and vulnerability to pollution sources. In close collaboration with a predominantly Latinx community in Chicago, we highlight the usefulness
of our approach through a case study that shows how certain community areas in the city are likely to bear a disproportionate burden of
environmental pollution caused by industrial roads.
                            @article{flax2021visualizing,

                                title={Visualizing Environmental Justice Issues in Urban Areas with a Community-based Approach},

                                author={Flax-Hatch, Joel and Srabanti, Sanjana and Miranda, Fabio and Sambanis, Apostolis and Cailas, Michael D},

                                journal={arXiv preprint arXiv:2112.06119},

                                year={2021},

                              }
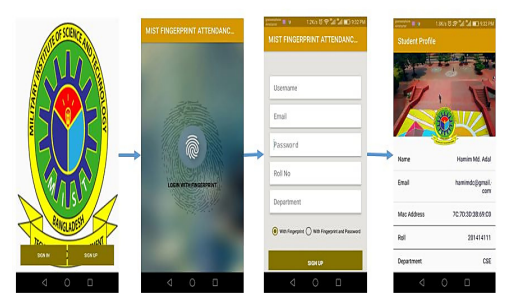
In this digital era, different organizations have started taking attendance using biometric fingerprint authentication.
This will keep the track of employee's attendance but the question arises if the employee is fully present at his/her workplace after giving attendance.
In this modern era of digitalization, it is seen that after giving attendance a huge number of employees escape away from their workplace and do their personal job in the office time.
This paper focuses on a smart attendance system where an android device will be used as a smart ID card.
A mobile application is developed in Java to ensure the attendance of an individual employee using bio-metric fingerprint authentication.
In addition, the entire working place will be a Wi-Fi zone.
So, the connection or disconnection of the android device (Smart ID card) to the router will determine whether an employee is present in the working place or not.
A counter will be there into the system to count the total amount of time an employee spends in the working place.
                            @inproceedings{adal2018android,

                                title={Android based advanced attendance vigilance system using wireless network with fusion of bio-metric fingerprint authentication},

                                author={Adal, Hamim and Promy, Nawsheen and Srabanti, Sanjana and Rahman, Mahbubur},

                                booktitle={2018 20th International Conference on Advanced Communication Technology (ICACT)},

                                pages={217--222},

                                year={2018},

                                organization={IEEE},

                              }
Now a days, the alarming rise of road accidents has become one of the major concerns in Bangladesh.
Unawareness and disrespect towards traffic rules, reckless driving, rapid growth of vehicles etc can be identified as factors leading to this issue.
The distress of the accident victims can be reduced if the detection of accidents can be done in no time.
Often emergency supports can not be provided immediately due to unawareness of the accident to the concerned persons.
On the other hand, vehicle theft has also become a common issue which everyone faces in insecure parking places.
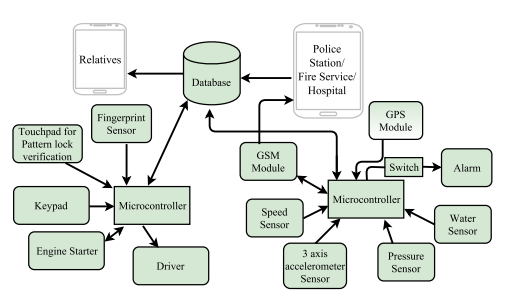
In this paper, an automated system has been proposed to deal with these two interrelated affairs.
Our proposed system will help the wretched victims by notifying the nearest necessary emergency supports.
The system also have two levels of security, password protection for the vehicle, speed control mechanism and remote ignition cut-off mechanism to make vehicle theft almost impossible.
Therefore, our cost effective proposed system will be efficacious for a developing country like Bangladesh to diminish the distress of the people.
                            @inproceedings{srabanti2018proposed,

                                title={A proposed system for automatic vehicle monitoring and accident detection in Bangladesh},

                                author={
                                Srabanti, Sanjana and Asaduzzaman, Md and Mokter, Muhammad Kivran Bin and Anannya, Tasmiah Tamzid
                                and Tumpa, Sanjida Nasreen and Afroze, Lameya and Shawon, Nafin and Refath, Naznin Sultana
                                and Karim, Md Mahboob
                              },

                                booktitle={
                                2018 International Conference on Computer, Communication, Chemical, Material and Electronic Engineering (IC4ME2)
                              },

                                pages={1--5},

                                year={2018},

                                organization={IEEE},

                              }
A noticeable number of people living in extreme poverty still remain high in Bangladesh.
It is becoming challenging for the poor or low-income people to pay for their health purpose.
Thus they suffered from various diseases and as a result the death rate is increasing day by day.
On the other hand, there are many people who have plenty of leftover medicines even after finishing those medicines consumption.
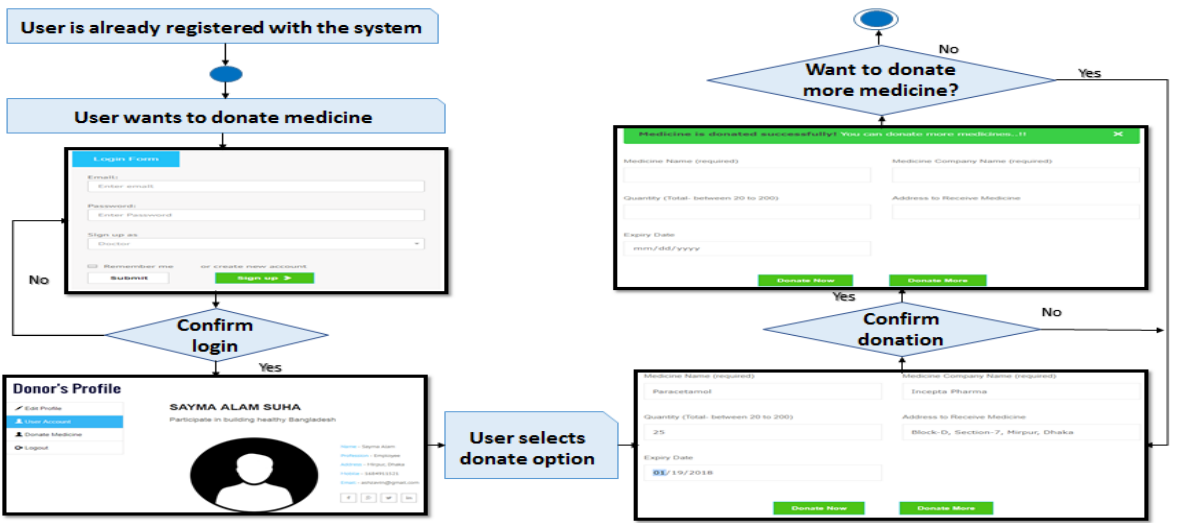
In this paper, we have proposed a medicine distribution web portal, named ‘GiveMed’. The GiveMed is a platform for the donors who want to donate their unused medicines to the poor or low-income people who need those medicines.
This system will contribute to reduce the cost for national health services by making the proper use of unused medicines; and to help the poor or low-income people to get better health services.
The portal was also evaluated with 16 participants (including doctors, donor, NGO personnel and low-income people) and found that the portal is highly effective, efficient, satisfiable and useful system.
                            @inproceedings{islam2017givemed,

                              title={GiveMed: a webportal for medicine distribution among poverty-stricken people},

                              author={
                              Islam, Muhammad Nazrul and Zavin, Ashratuz and Srabanti, Sanjana and Ferdous, Chowdhury Nawrin
                              and Suha, Sayma Alam and Afroze, Lameya and Shawon, Nafin and Refath, Naznin Sultana
                            },

                              booktitle={
                              2017 IEEE Region 10 Humanitarian Technology Conference (R10-HTC)
                            },

                              pages={294--299},

                              year={2017},

                              organization={IEEE},

                            }