Figure:
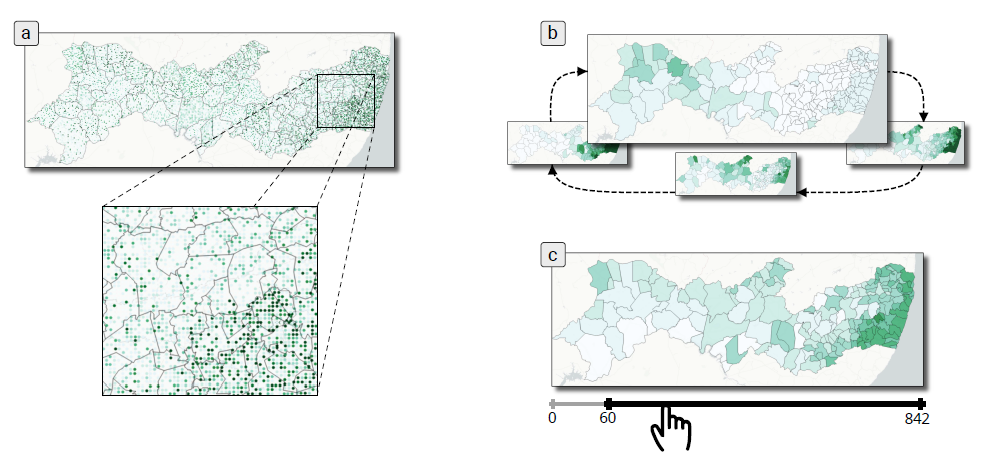
Visual metaphors for the visualization of a probability distribution of geographical data
that support probability quantification of analytical tasks tested in this study: (a) distribution dot
map (DDM), where dots are randomly positioned inside the regions and are colored according to the
sampled value, (b) hypothetical outcome maps (HOM), where a series of maps are created based
on the probability distribution, and then animation is used to cycle through them, (c) distribution
interaction map (DIM), where the user can quantify the probability distribution using interactive
widgets and annotations.
Abstract
Probability distributions are omnipresent in data analysis. They are often used to model the
natural uncertainty present in real phenomena or to describe the properties of a data set. Designing
efficient visual metaphors to convey probability distributions is, however, a difficult problem. This
fact is especially true for geographical data, where conveying the spatial context constrains the design
space. While many different alternatives have been proposed to solve this problem, they focus on
representing data variability. However, they are not designed to support spatial analytical tasks
involving probability quantification. The present work aims to adapt recent non-spatial approaches
to the geographical context, to support probability quantification tasks. We also present a user study
that compares the efficiency of these approaches in terms of both accuracy and usability.
Probability distributions are omnipresent in data analysis. They are often used to model the
natural uncertainty present in real phenomena or to describe the properties of a data set. Designing
efficient visual metaphors to convey probability distributions is, however, a difficult problem. This
fact is especially true for geographical data, where conveying the spatial context constrains the design
space. While many different alternatives have been proposed to solve this problem, they focus on
representing data variability. However, they are not designed to support spatial analytical tasks
involving probability quantification. The present work aims to adapt recent non-spatial approaches
to the geographical context, in order to support probability quantification tasks. We also present a
user study that compares the efficiency of these approaches in terms of both accuracy and usability.
                          @article{srabanti2022comparative,

                            title={A comparative study of methods for the visualization of probability distributions of geographical data},

                            author={Srabanti, Sanjana and Veiga, Carolina and Silva, Edcley and Lage, Marcos and Ferreira, Nivan and Miranda, Fabio},

                            journal={Multimodal Technologies and Interaction},

                            volume={6},

                            number={7},

                            pages={53},

                            year={2022},

                            publisher={MDPI}

                          }