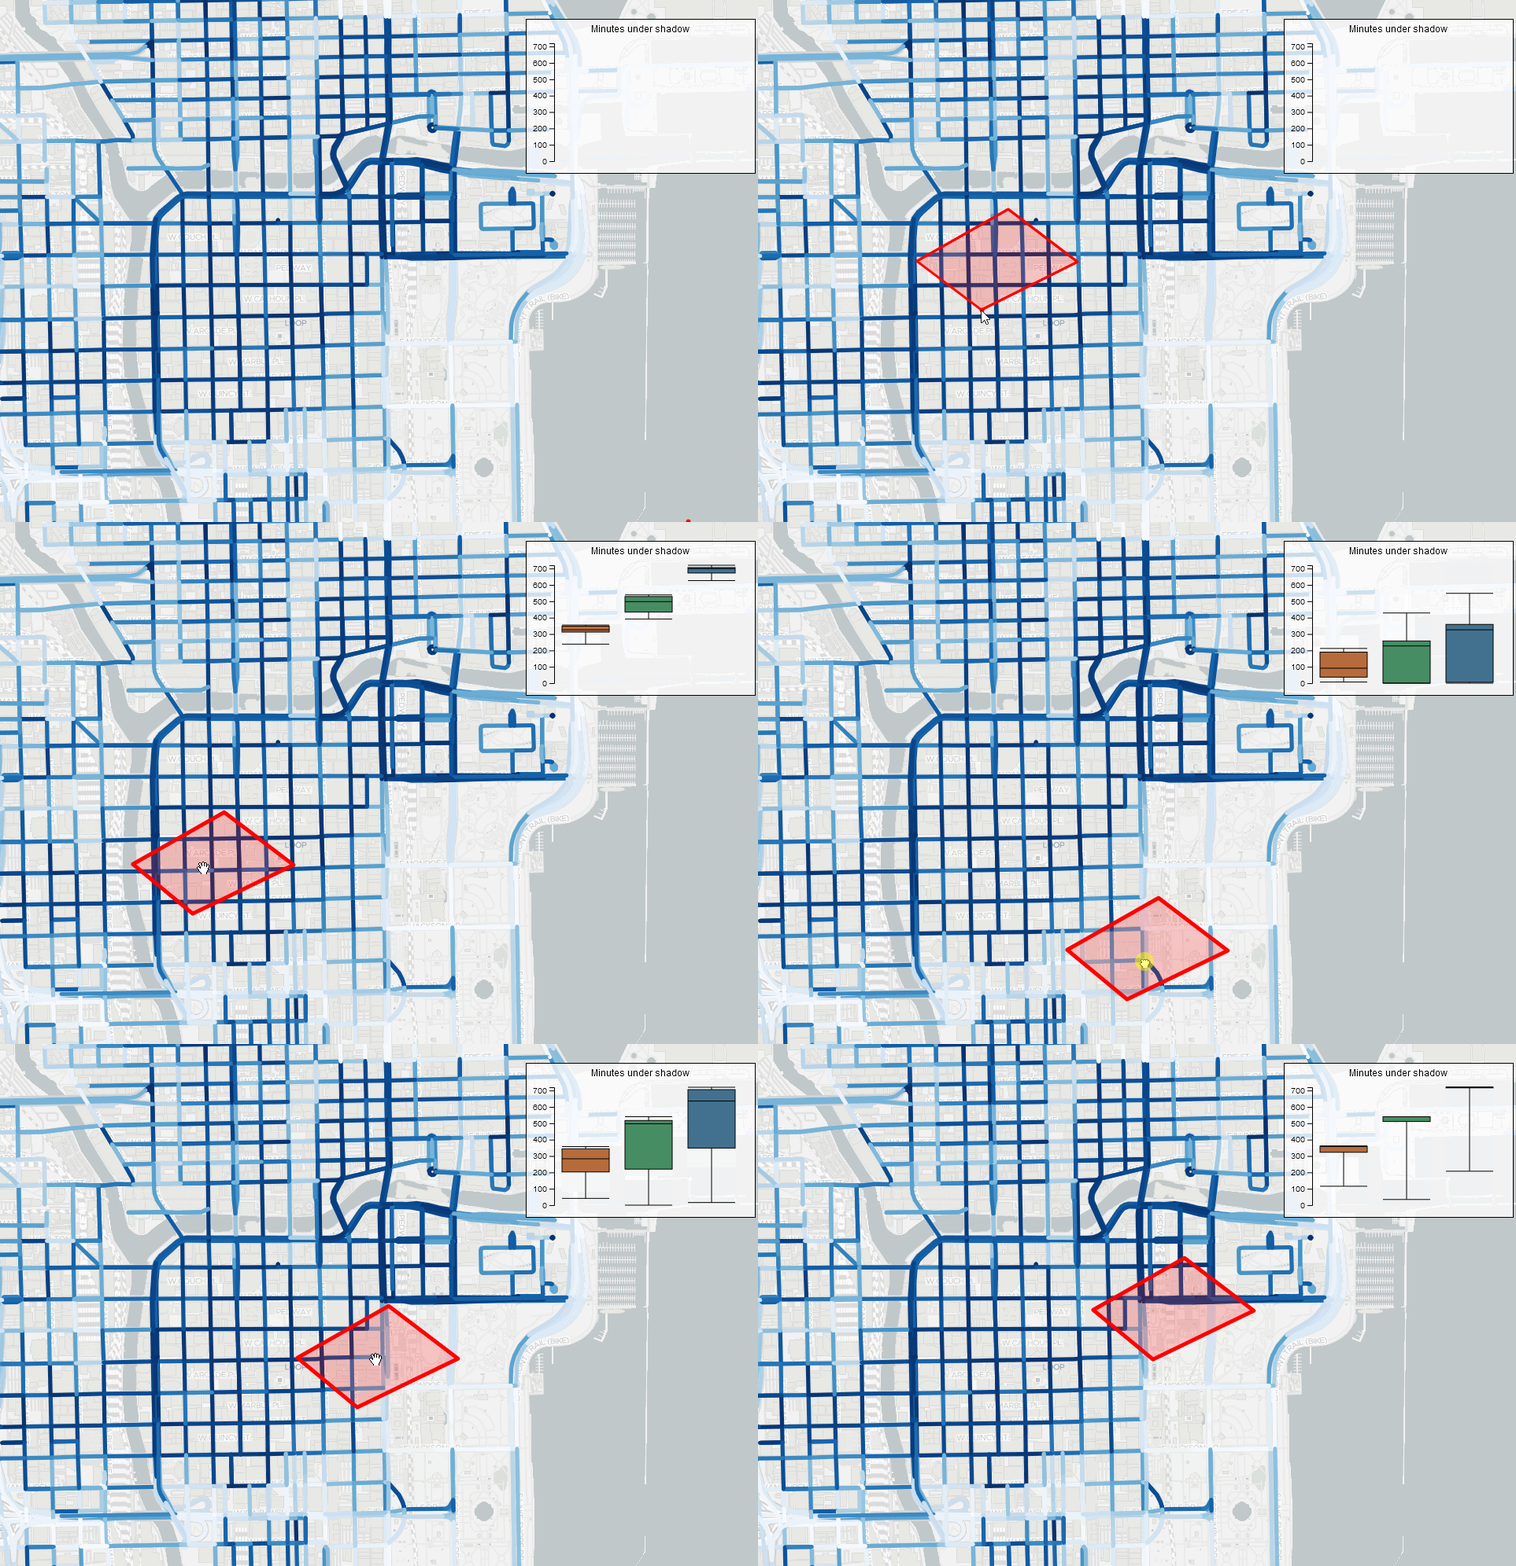
Street Shadow Map
Tools used: Angular, TypeScript, D3.js, Flask, OpenLayers, HTML, CSS.
This project visualizes the spatial distribution of accumulated shadows across the streets of Chicago during different seasons. It features an interactive web application allowing users to explore shadow patterns throughout the city, providing valuable insights into how sunlight and shadow dynamics impact urban areas over the year. Accumulated shadows were calculated specifically for three significant dates: June 21 (summer solstice), September 22 (autumnal equinox), and December 21 (winter solstice). To ensure accuracy, shadows distorted by proximity to the horizon were excluded, restricting computations to a window from one and a half hours after sunrise to one and a half hours before sunset.
