Figure:
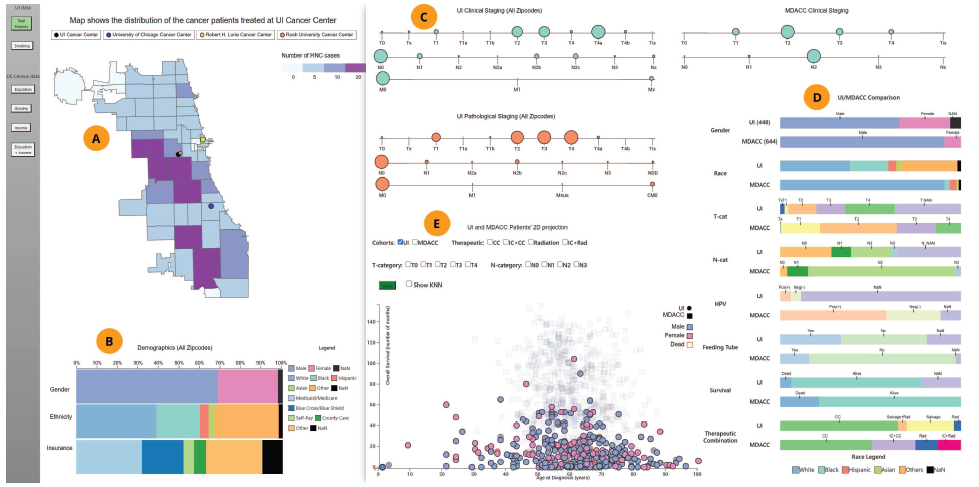
A tale of two head and neck cancer centers, UI and MDACC. (A) A geospatial panel shows the number of patients
treated at UI, along with the other centers in the area and census data; the data is not normalized by population, to better illustrate
catchment. Most patients come from just a few neighborhoods. (B) Demographics pane, showing a diverse population and very
few patients without known medical insurance. (C) Disease staging panel for the two populations, showing UI patients report
later for diagnosis and treatment. (D) Summarization panel comparing the two populations based on demographic and disease
characteristics, treatments, and outcomes. (E) Scatterplot panel comparing patients with respect to their age at diagnosis (x-axis)
and overall survival (y-axis). In this view, the MDACC patients are filtered out via transparency, to allow better focus on the UI
population.
Abstract
The annual incidence of head and neck cancers (HNC) worldwide is more than 550,000 cases, with around 300,000 deaths each year.
However, the incidence rates and disease-characteristics of HNC differ between treatment centers and different populations, due to undetermined reasons, which may or not include socioeconomic factors.
The multi-faceted and multi-variate nature of the data \textcolor{black}{in the context of the emerging field of health disparities research} makes automated analysis impractical.
Hence, we present a visual analysis approach to explore the \textcolor{black}{health disparities in the} data of HNC patients from two different cohorts at two cancer care centers.
Our approach integrates data from multiple sources, including census data and city data, with custom visual encodings and with a nearest neighbor approach. Our design, created in collaboration with oncology experts, makes it possible to analyze the patients’ demographic, disease characteristics, treatments and outcomes, and to make significant comparisons of these two cohorts and of individual patients.
We evaluate this approach through two case studies performed with domain experts.
The results demonstrate that this visual analysis approach successfully accomplishes the goal of comparing two cohorts in terms of different significant factors, and can provide insights into the main source of health disparities between the two centers.
The annual incidence of head and neck cancers (HNC) worldwide is more than 550,000 cases, with around 300,000 deaths each year.
However, the incidence rates and disease-characteristics of HNC differ between treatment centers and different populations, due to undetermined reasons, which may or not include socioeconomic factors.
The multi-faceted and multi-variate nature of the data in the context of the emerging field of health disparities research makes automated analysis impractical.
Hence, we present a visual analysis approach to explore the health disparities in the data of HNC patients from two different cohorts at two cancer care centers. Our approach integrates data from multiple sources, including census data and city data, with custom visual encodings and with a nearest neighbor approach.
Our design, created in collaboration with oncology experts, makes it possible to analyze the patients' demographic, disease characteristics, treatments and outcomes, and to make significant comparisons of these two cohorts and of individual patients.
We evaluate this approach through two case studies performed with domain experts.
The results demonstrate that this visual analysis approach successfully accomplishes the goal of comparing two cohorts in terms of different significant factors, and can provide insights into the main source of health disparities between the two centers.
                          @inproceedings{srabanti2022tale,

                              title={A tale of two centers: Visual exploration of health disparities in cancer care},

                              author={Srabanti, Sanjana and Tran, Michael and Achim, Virginie and Fuller, David and Canahuate, Guadalupe and Miranda, Fabio and Marai, G Elisabeta},

                              booktitle={2022 IEEE 15th Pacific Visualization Symposium (PacificVis)},

                              pages={101--110},

                              year={2022},

                              organization={IEEE}

                            }