COVID-19 Symptoms
Analyzing County-level COVID-19 Symptoms Pattern and Risk-factors Correlated with Hospitalization Rate, ICU Treatments and Morbidity Rate
Tools used: Python, Pandas, NumPy, Scikit‑learn, D3.js, JavaScript, HTML, CSS.
Abstract
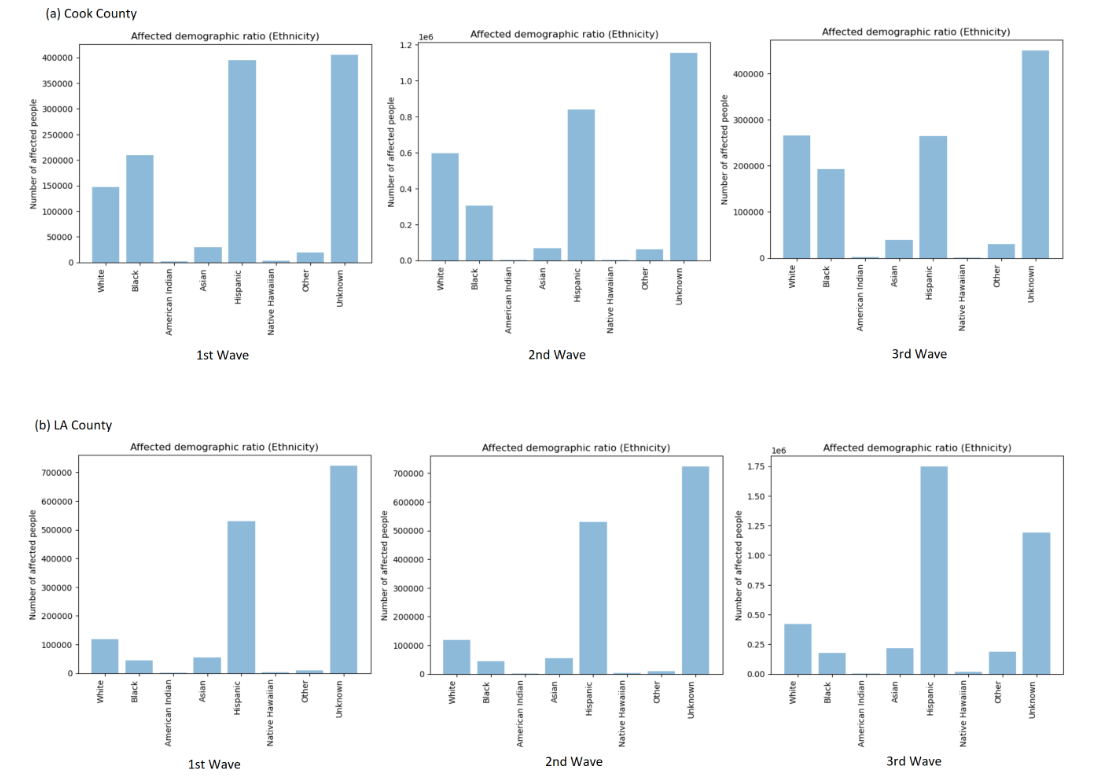
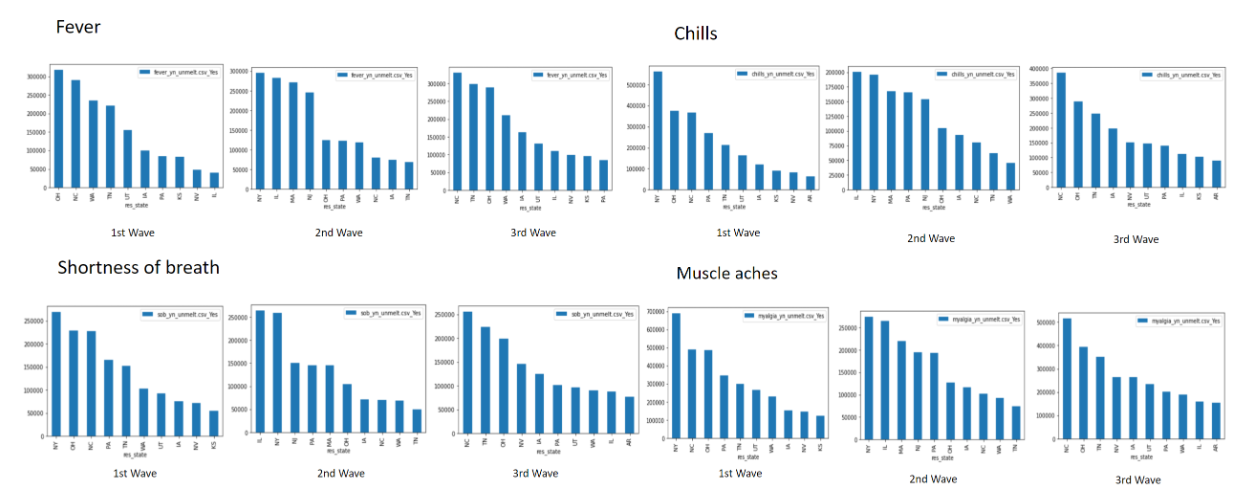
In response to the COVID-19 pandemic, timely and accurate analysis of symptom patterns, hospitalization, ICU treatments, and mortality rates has become critical for effective public health interventions. This study presents a comprehensive visual analytics tool developed from CDC's restricted-access, county-level COVID-19 surveillance dataset. Our approach enables the comparison of various U.S. regions based on demographics, symptoms, and vulnerability indicators. We employed statistical analysis, correlation studies, dimensionality reduction (PCA), and clustering techniques (K-means) to uncover meaningful patterns and categorize counties according to their vulnerability to COVID-19. The results highlight significant differences in morbidity, hospitalization, ICU admission, and symptom severity across counties, revealing demographic factors such as age and ethnicity as strong predictors. Our tool effectively illustrates how COVID-19 symptom profiles evolve over time, emphasizing the critical symptoms most associated with mortality in various states. Ultimately, our visual analytics framework offers an intuitive method for public health authorities to identify at-risk regions, prioritize interventions, and enhance preparedness for future outbreaks.


